2026 Dental Industry Outlook: Deep Dive
The 2026 Dental Industry Outlook: Deep Dive report takes a closer look at what’s really driving performance across today’s dental organizations. Based on data from more than 8,500 dental practices, 497 DSOs, and 2,500 Cloud 9 ortho practices, this analysis uncovers the patterns shaping growth, efficiency, and financial outcomes across the industry.
While the 2026 Dental Industry Outlook Report highlights key trends, this deep dive focuses on the underlying data and how practices are actually performing, where gaps exist, and what separates the industry’s fastest-growing practices from the rest of the field.
Download the full deep dive report to explore the complete dataset and benchmarks. It includes sixteen sections covering same-store growth, the DSO size paradox, production benchmarks by specialty, appointment operations, the revenue cycle waterfall, AR aging benchmarks, and a complete set of warning, target, and elite zone metrics for DSO operators to benchmark their own performance.
What the Deep Dive Reveals About Industry Growth
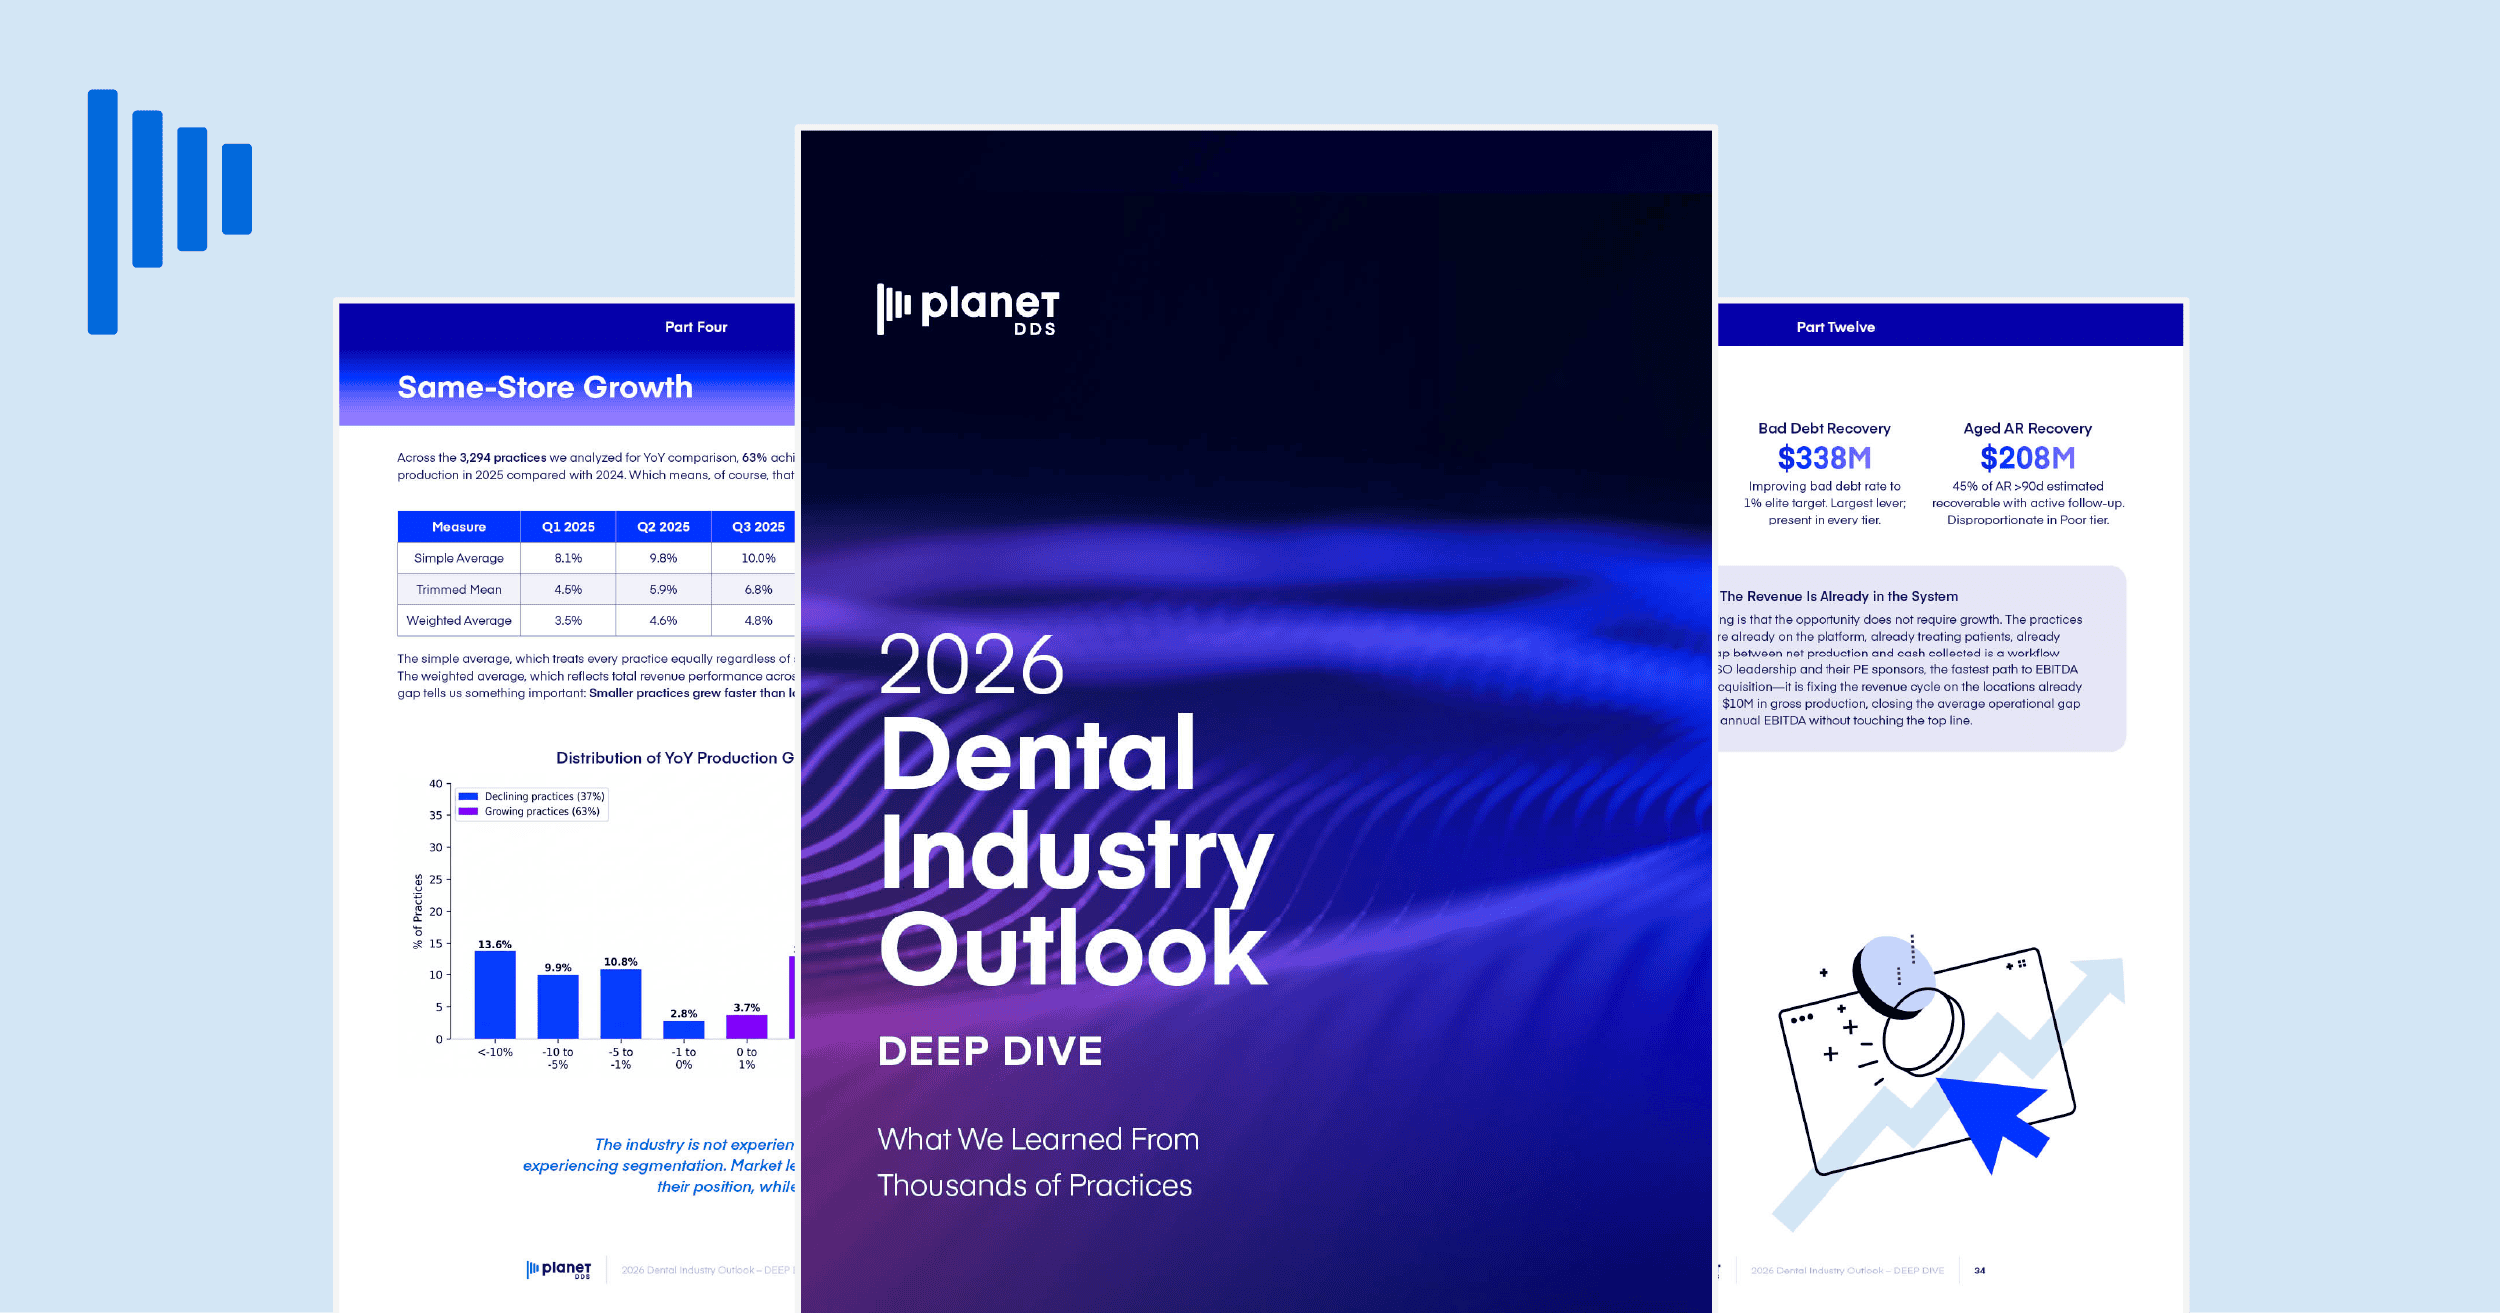
The data confirms that the industry is splitting into distinct performance tiers. While 63% of practices experienced growth, more than one-third grew by over 10%, and nearly 14% declined at the same rate.
This widening gap reflects differences in how organizations operate day to day, not just broader market conditions. Practices with similar patient volumes and production levels can see very different outcomes depending on how effectively they manage scheduling, follow-through, and financial processes.
Here are six DSO benchmarking findings that the Deep Dive revealed about growth and performance that challenge the industry assumptions:
1. New patient acquisition predicts growth.
Among all variables analyzed, new patient volume stands out as the strongest predictor of growth. Practices seeing higher volumes of new patients consistently outperform their peers, with those exceeding 75 new patients per month growing at nearly double the rate of lower-volume practices.
There is also a clear inflection point. Around 35 new patients per month, growth begins to accelerate. Below that threshold, many practices remain relatively flat. Above it, they begin to build sustained momentum.
This reinforces a simple but important idea: Growth starts with demand. Operational improvements and efficiency gains matter, but without a steady pipeline of new patients, those gains have limited impact on overall performance.
1. Operational consistency improves performance.
Daily operational consistency emerged as one of the strongest indicators of performance. Practices with stable production patterns grow significantly faster than those with high variability.
The difference is substantial. The most consistent practices achieved steady growth, while the most volatile practices experienced decline. Consistent practices produce 28% more revenue per day, signaling that schedule stability directly drives both top-line and operational performance.
Consistency also shows up in scheduling patterns. Practices that maintain strong production throughout the week—including traditionally underutilized days like Friday—tend to outperform peers who concentrate production earlier in the week.
Over time, that consistency compounds. More predictable schedules lead to better capacity utilization, stronger patient flow, and more reliable financial performance.
2. Practice efficiency wins over size.
One of the most consistent findings in the report is that scale alone does not drive growth. Increasing chair count or expanding locations does not guarantee better outcomes.
Instead, efficiency—measured as revenue per chair—has a far stronger impact. The data shows that practices generating higher revenue per chair grow significantly faster than those with underutilized capacity.
Nearly 1,050 practices average 44 chairs but generate only $56K in annual revenue per chair, underutilized capacity representing the largest addressable opportunity in the dataset.
3. The 26 to 50 office range often stalls momentum.
There is a pattern in the data that should concern any DSO executive planning for growth, and it concerns the relationship between organizational size and growth rates.
DSOs in this size range grow at just 2.8%—less than one-third the rate of their smaller peers. Only 55% of their offices are growing, the lowest of any tier. The message is clear: If you are a DSO at 20 offices, do not rush to 50. You may hit a growth wall. Either stay lean and nimble or build the infrastructure to push through to enterprise scale. Do not get stuck in the middle.
“The industry is splitting. One-third of practices grew by more than 10% last year. Nearly 14% declined by more than 10%. The middle is getting squeezed. The practices that are winning figured out the fundamentals. That is what is making the difference.” —Eric Giesecke, CEO of Planet DDS
4. Case completion impacts revenue outcomes.
Case acceptance remains one of the most widely tracked metrics in dentistry, but the data shows it is not the primary constraint on growth. Case completion—whether accepted treatment is actually performed—has a much greater impact on revenue outcomes.
On average, only 47% of accepted treatment plans are completed within the year. That gap represents significant unrealized production and points to breakdowns in scheduling and follow-through.
Organizations that prioritize consistent next-appointment scheduling and structured follow-up processes are better positioned to convert accepted treatment into completed care, improving both production and predictability.
5. Revenue cycle efficiency is major EBITDA lever.
The most important revenue cycle management (RCM) finding is that the opportunity does not require growth. Revenue cycle efficiency is the silent EBITDA lever. Growing practices are not necessarily collecting practices. For a DSO generating $10M in gross production, closing the average operational billing gap adds approximately $890K in annual EBITDA, without touching the top line.
The largest sources of leakage occur early in the process, including point-of-service collections and insurance reimbursement gaps. These upstream inefficiencies create downstream challenges, contributing to aging receivables and write-offs.
What Data Means for DSOs and Dental Groups
Taken together, the findings point to a shift in how performance should be evaluated. Growth is not simply a function of size, and operational maturity does not always translate into stronger results.
Organizations that perform best tend to align a few key areas:
- Consistent new patient acquisition to support demand
- Efficient use of existing capacity before expansion
- Standardized workflows that improve execution across locations
- Strong revenue cycle processes that reduce financial leakage
When these elements work together, they create a more stable and scalable foundation for growth, one that is driven by execution, not just expansion.
Turn Deep Dive Insights into Measurable Growth
The 2026 Dental Industry Outlook: Deep Dive report highlights a clear pattern across the data: Performance gaps are not random; they are operational. From patient acquisition and scheduling discipline to production consistency and revenue cycle execution, the difference between growth and stagnation often comes down to how consistently organizations execute across these areas.
Organizations seeing stronger results are not relying on expansion alone. They are identifying where production is left incomplete, capacity is underutilized, and revenue is not fully captured, and then acting on those opportunities with greater precision.
Want to uncover untapped opportunities for growth? Contact Planet DDS to learn how your team can apply these data insights across your organization.