DSO Reporting: Turning Data into Real Insights for Multi-Locations
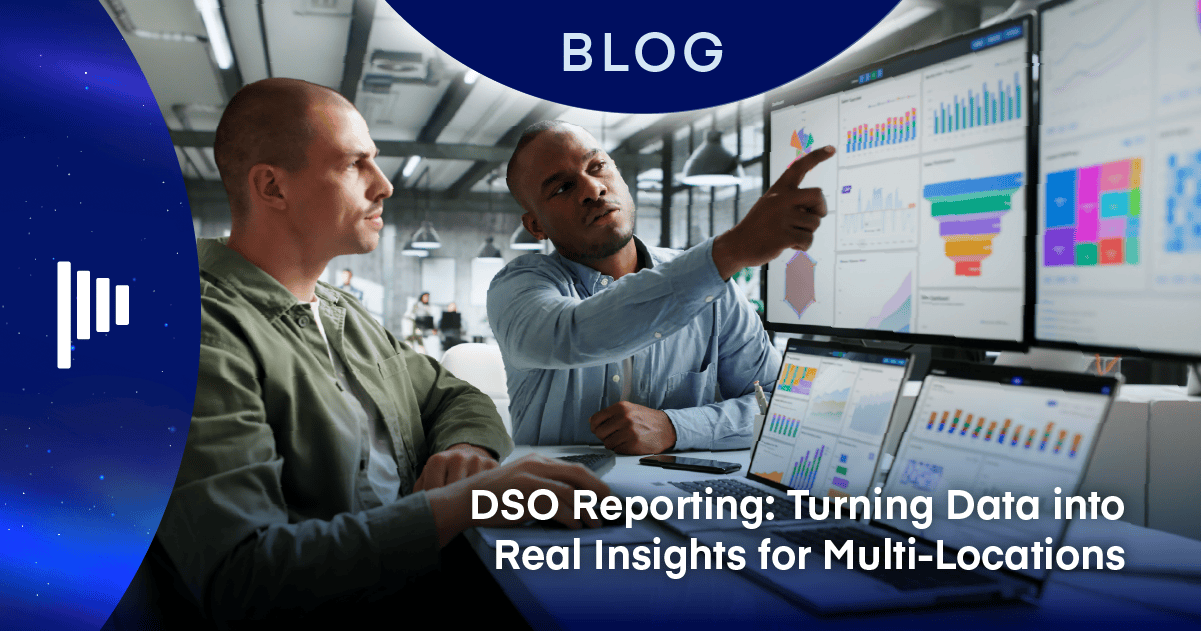
For dental support organizations (DSOs), reporting becomes more complex with every location added to the organization. Production, collections, patient activity, provider performance, revenue cycle metrics, and other information may all be available, but making that data useful across dozens or hundreds of practices requires consistency in how it is captured, measured, and reviewed.
The challenge goes beyond generating reports. Leaders need to understand whether the numbers mean the same thing from one location to another, where performance differs, and what those differences reveal about the organization.
Dental practice management software can provide a common source for operational and financial information across locations. When reporting and analytics draw from consistent data, leaders gain a clearer view of what is happening throughout the organization and where deeper analysis may be needed.
That need is becoming increasingly important as DSOs invest in technology. According to the ADA Health Policy Institute, 29% of DSO-affiliated dentists planned to invest in new software in 2026, compared with 16.3% of non-DSO dentists. As organizations expand their technology ecosystems, the ability to maintain consistent data and reporting becomes an important part of that investment.
DentalOS® supports this approach by connecting dental practice management and other enterprise capabilities through a shared platform. Within Denticon, reporting and analytics give DSOs a way to examine performance across locations without relying on separate reporting processes at every office.
How Can DSOs Get Consistent Reporting Across Locations?
Consistent DSO reporting requires common data, clearly defined metrics, and reporting tools that allow leaders to examine results at the level appropriate to the decision. Without those elements, organization-wide reporting can still reflect differences in how individual locations capture and interpret information.
Consistency starts with the data behind the reports.
At a single dental practice, leaders may be able to review local reports, talk directly with the team, and develop a clear understanding of what is happening. That becomes considerably harder when an organization operates at twenty, fifty, or 100 locations.
Individual practices may perform differently for legitimate reasons. Patient demographics, payer mix, specialty, provider capacity, and local market conditions can all influence results. But differences can also arise from how information is entered, categorized, or interpreted.
That makes consistent multi-location dental reporting an enterprise concern. Leaders need enough visibility to understand overall performance while retaining the ability to examine individual locations and determine what is driving the numbers.
With more than 130 practices and growing, Imagen Dental Partners finds that consistency starts with the unified practice management platform.
“It gives us the data consistency, workflow visibility, and operating foundation required to scale effectively.” —Rezwan Manji, CEO of Imagen Dental Partners
The Planet DDS 2026 Dental Industry Outlook: Deep Dive analyzed more than 8,500 practices across 497 DSOs and $6.79 billion in gross production. The analysis found a 9.5% growth gap between the most consistent and other practices. The most consistent practices also generated 28% more revenue per day.
Leaders need comparable information before they can determine where performance differs and what deserves closer attention.
Comparable metrics provide a clearer view across locations.
A centralized dashboard does not automatically make the information behind it comparable. If locations define or capture the same metric differently, a consolidated report can still produce an incomplete or misleading view.
Consider production, collections, adjustments, case acceptance, or reappointment rates. Each metric depends on rules about what is included, when activity is counted, and how it is attributed. Differences in procedure codes, adjustment codes, provider assignments, location assignments, or reporting periods can change what appears in the final number.
Common definitions and standardized workflows give leaders a stronger basis for comparing offices, providers, regions, and time periods. They also make it easier to investigate a difference rather than first determining whether two locations calculated the metric the same way.
That distinction becomes more important as an organization grows. A reporting process that relies on an office exporting, formatting, or interpreting information independently creates more opportunities for variation each time another practice is added.
What Makes Multi-Location Reporting More Useful?
Consistent DSO reporting depends on a reliable source of data and the ability to view that information at different levels of the organization. Centralized reporting can reduce the need to assemble information from separate offices while giving leaders a shared basis for evaluating performance.
A common data source reduces reporting discrepancies.
When locations operate from separate databases or systems, organization-wide reporting may require information to be exported, combined, normalized, or reconciled before leadership can use it.
That process becomes increasingly difficult to maintain as the number of locations grows.
Denticon is built around a centralized cloud database, allowing authorized users to work with information across locations from the same practice management system. Reporting can therefore be consolidated or examined by location without requiring every office to maintain an independent reporting environment.
This is particularly relevant to end-of-day reports. For an individual practice, this type of report may provide a straightforward review of activity. Across a DSO, however, leadership may need to understand what happened at one office, compare it with other locations, or examine organization-wide results.
That daily reporting becomes one view within a larger reporting model rather than the endpoint. The same underlying data can support daily oversight as well as broader analysis over longer periods.
A common source also reduces the need to assemble spreadsheets from multiple offices simply to establish an organization-wide view. Instead, leaders can spend more time examining what the information means and where additional investigation may be warranted.
The right view depends on the decision being made.
Multi-location reporting does not mean every user needs the same report. Executives may need an organization-wide view of performance, while regional leaders, office managers, providers, and billing teams need information relevant to their areas of responsibility.
DentalOS® brings Denticon and connected enterprise capabilities into one platform, giving DSOs a broader ecosystem for the operational and financial data generated across the organization. Within Denticon, reporting and analytics help turn that data into information leaders can use to evaluate performance across locations.
Denticon Practice Analytics provides several ways for teams to work with performance data:
- Role-based dashboards: Tailored views provide DSO executives, office managers, front-office teams, providers, and billing teams with information relevant to their responsibilities.
- Performance metrics: Teams can monitor net production, collection percentages, provider utilization, and patient retention.
- Treatment and hygiene analytics: Reporting includes case acceptance as well as hygiene recall and reappointment percentages.
- Detailed patient reporting: Users can move into detailed reports to identify patient cohorts behind broader performance measures.
- Patient outreach: Teams can use those reports to send targeted SMS or email communications.
- Automated data updates: Enterprise data refreshes automatically, reducing the need to manually rebuild recurring analytics.
That ability to move among organizational levels can make reporting more useful. An enterprise number can indicate that something deserves attention, but leaders often need more detail before deciding what action to take.
A decline in collections, for example, means something different if it is occurring throughout the organization than if it is concentrated in a handful of locations. Similarly, an organization-wide average can appear stable while individual offices move in very different directions.
The goal is not simply to collect more metrics; it’s to make relevant information available to the teams responsible for understanding and acting on it.
How Can Analytics Turn Reporting into Action?
Reporting helps leaders understand what happened, while analytics can provide additional context around patterns, differences, and trends in the data. That can make it easier to identify where performance warrants further investigation and where an effective approach may be worth applying elsewhere.
Analytics reveal what aggregate numbers can hide.
A key performance indicator (KPI) on its own provides a measurement. Its value increases when leaders can examine the information behind it.
Consider a change in production. An organization-wide number may show whether production increased or declined, but leadership may also need to understand which locations contributed to the change, whether provider utilization changed, or whether another operational factor influenced the result.
The same principle applies across other areas of the business. Collections, case acceptance, patient retention, hygiene reappointment, and provider utilization can become more informative when teams can examine differences across locations or time periods.
This is where consistent practice analytics become particularly useful for multi-location organizations. Instead of treating every report as a separate output, leaders can use reporting as a starting point for asking better questions about performance.
The Planet DDS Deep Dive report demonstrates the value of looking beneath organization-wide averages. Its analysis found that DSOs with 26 to 50 locations grew at 2.8%, while only 55% of offices in that group were growing. The finding illustrates how organizational size or an overall result may not fully explain what is happening at the practice level.
Analytics can help surface those differences so performance discussions are based on what the data actually shows rather than assumptions about size, location, or growth.
For Imagen Dental Partners, having a more unified view of its data helps teams access information more effectively.
“You’re able to make decisions quicker. You’re able to move quicker, move more accurately, and have more confidence.” —Rezwan Manji, CEO, of Imagen Dental Partners
Financial data can inform planning beyond the reporting period.
Revenue cycle management (RCM) generates information throughout the patient and payment lifecycle. Accounts receivable, denials, collections, insurance activity, and payment posting can all provide insight into how effectively revenue is moving through the organization.
RCM reporting can track KPIs such as A/R days, denial rates, and collection efficiency. Consistent financial data can also support forecasting and longer-term budgeting, helping organizations use revenue metrics for forward-looking planning.
That changes the purpose of reporting. A report can document what happened during the previous day, month, or quarter, but the information can also help recognize patterns that affect future decisions.
The value comes from having data that is consistent enough to evaluate over time and detailed enough to investigate when results change.
What Can RCM Reporting Reveal Across Locations?
RCM reporting gives DSOs visibility into financial activity across locations, including claims, insurance, collections, and accounts receivable. When that information can be reviewed consistently, RCM teams can identify where revenue is progressing as expected and where additional attention may be required.
Revenue cycle data provides another view of organizational performance.
Revenue cycle information is generated across many processes. Insurance eligibility and verification, claims submission, payment posting, denial management, patient payments, and collections all contribute to information that eventually affects financial performance.
Reporting and analytics across locations can help decision-makers identify financial trends and operational bottlenecks by providing greater insights into connected billing, scheduling, and clinical information.
Denticon RCM provides reporting across locations to give teams greater insight into areas including:
- Ledger activity: Review financial activity recorded across locations.
- Insurance: Gain insights into insurance-related information across the organization.
- Claims: Review claims information to understand where follow-up may be needed.
These reporting capabilities give teams a more complete view of revenue cycle activity across locations. For leadership, standardized data can provide greater visibility into revenue performance. For RCM teams, more detailed reporting can help identify where follow-up may be needed.
This is another reason reporting should not be separated from the workflows generating the data. When financial information is available within the broader operational environment, teams can move from reviewing a number toward understanding the activity behind it.
Reporting cadence should reflect the decisions teams need to make.
The cadence of reporting also matters. Some information needs to be reviewed frequently because waiting until the end of a month or quarter can allow an issue to continue unnoticed.
West Coast Dental Services utilizes Denticon reporting to monitor several parts of its revenue cycle across different reporting periods.
“We’re able to report data on a daily, monthly, and year-to-date basis. We can check on collections, revenue generation, insurance benefits, where claims stand in terms of billing or aging,” “It’s very user-friendly, and by making it easier and faster for the team, we’re able to provide a better patient experience.” —Karla Morales, Vice President of Revenue Cycle Management, West Coast Dental Services
The important point is not that every metric needs to be reviewed every day. Different measures support different decisions and reporting cadences. The reporting environment should make it possible to review the appropriate information when it is useful rather than requiring teams to recreate the same analysis manually each time.
What Should DSOs Look for in Reporting and Analytics?
As reporting expands from individual office reports to organization-wide analytics, DSOs need to evaluate more than the number of dashboards or reports available. The larger question is whether the technology can provide consistent information that leaders and teams can use across a growing organization.
- Does reporting draw from a common source of practice data across locations?
- Are important metrics defined and calculated consistently throughout the organization?
- Can leaders review information at the organization, region, location, and provider levels when appropriate?
- Can users move from a high-level metric into the underlying information needed to investigate it?
- Can financial reporting provide visibility into claims, insurance, collections, and accounts receivable across locations?
- Can the reporting model accommodate additional locations without requiring a separate process for every new practice?
These questions can help DSOs evaluate whether reporting technology provides the consistency, visibility, and detail needed to understand performance across a multi-location organization.
Turn DSO Reporting into Actionable Insights
Reporting becomes more valuable when leaders can rely on the information behind it and examine performance at the level needed for a particular decision.
Consistent data, centralized reporting, and analytics can give teams a common view while preserving the details needed to understand differences among locations, providers, and areas of the business.
DentalOS brings practice management and other enterprise capabilities into an integrated platform, while Denticon provides the operational data and reporting environment DSOs use to monitor performance. RCM reporting extends visibility into financial activity across the organization.
As dental organizations grow, the larger opportunity is to make reporting a resource for understanding what is happening, determining where attention is needed, and supporting better-informed decisions across the enterprise.
Want to find out how centralized reporting can support your DSO? Explore DentalOS enterprise platform solutions today.